
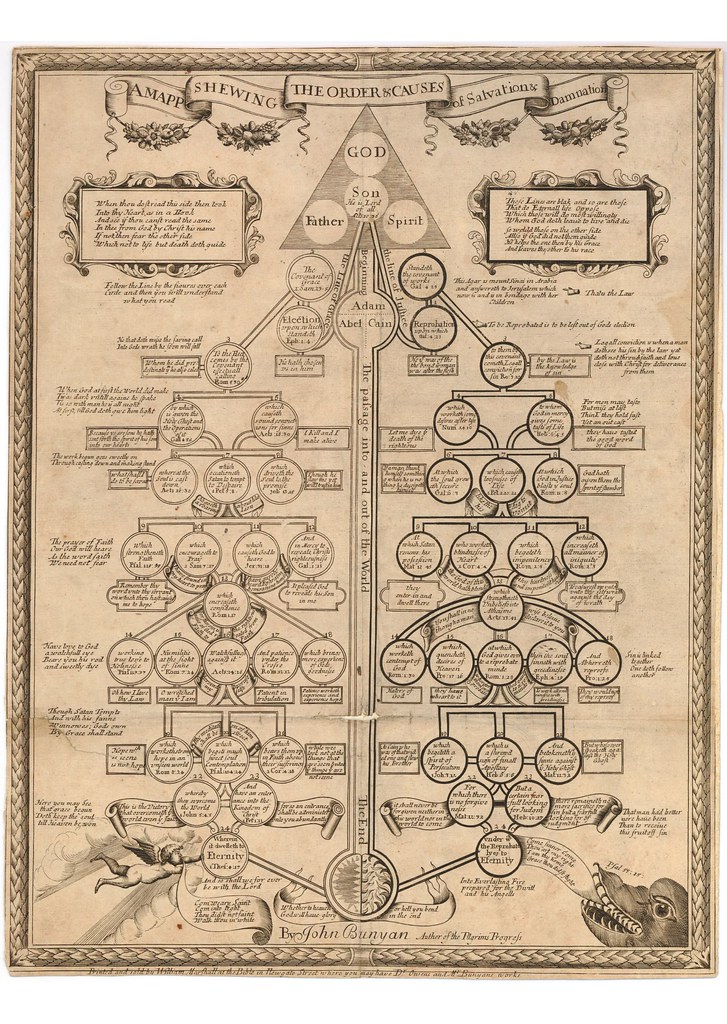
I am fascinated by charts — more specifically, charts used to provide visual representations of complex ideas or sequences. They’re a variety of mind map, I guess, though they represent the mind’s considered conclusions, not its initial ramblings. Consider for example the chart above, which was apparently created by John Bunyan in 1664 (details here, properly enormous reproduction of the broadsheet here). I will be posting charts from time to time and will be meditating on how they work, on their value as consolidations and presentations of thought. I may even post a few I use in class. Look for the “chart” label/tag if you want to see them all at once. Though for now there’s just this one.
Text Patterns
October 30, 2009
Edward Tufte has made a career of it:
http://www.edwardtufte.com/
I think you'll find a lot of interesting examples at his site.
I know Tufte's work well, and have mentioned it on this blog, but in a later post I'll try to explain how my interests are different from his. He's all about "the visual diaplay of quantitative information," whereas I'm interested in "the graphico-textual display of sequential or non-sequential thinking." More about that later.
What do you think of Ong's book on Peter Ramus on this topic?
Have you come across Strange Maps? http://strangemaps.wordpress.com – lots of fascinating maps there.